
Microsoft Advanced Excel Complete Guide 2026: Formulas, VLOOKUP, Pivot Tables and MIS Reports (Updated August 2026)
Every office job in Maharashtra — from data entry at a Pune fintech to MIS executive at a Sambhajinagar auto-component plant to accounts manager at a Sangli cooperative bank — uses Microsoft Excel daily. The difference between someone who types numbers into cells and someone who builds a VLOOKUP-driven MIS dashboard that refreshes in 30 seconds is not intelligence. It's training. The ABC Trainings Advanced Excel series covers the complete journey: from typing your first SUM formula all the way to building automated dashboards with Pivot Tables, conditional formatting, data validation, and financial functions that non-technical managers can use without help. This guide covers every module in the series — what each function does, when to use it, and why it matters on the job.
- Excel proficiency is the single most-checked skill in Maharashtra job postings outside core engineering roles — MIS, accounts, operations, HR, logistics all require it
- This guide covers the complete ABC Trainings Advanced Excel course: basic formulas, IF logic, VLOOKUP/HLOOKUP/INDEX-MATCH, text functions, Pivot Tables, charts, and MIS dashboards
- The distinction that gets you hired: knowing how to use VLOOKUP is good; knowing when to use INDEX-MATCH instead, and why, is what senior interviewers actually test
- MIS report builders earn Rs.3-5 LPA in Pune at entry level — the same profile that earns Rs.7-12 LPA at banks and NBFCs after 3 years with advanced Excel and Power BI
- CMYKPY scheme pays Rs.6,000-10,000/month during ABC Trainings Excel courses — making this one of the easiest certifications to fund in Maharashtra
Why Advanced Excel Is the Most Valuable Skill for Maharashtra Job Seekers in 2026
Advanced Excel is the most broadly demanded skill in Maharashtra job postings outside core engineering and software development roles. Walk into a 200-person auto-component company in Waluj, a cooperative bank in Sangli, a logistics company in Hadapsar, or an NBFC in Pune Camp, and every department — accounts, production planning, HR, inventory, procurement, MIS — runs on Excel. The National Skills Development Corporation identified MS Office proficiency as a top-5 skill gap across Maharashtra's MSME sector. The gap isn't that companies don't have Excel — every office has it. The gap is that most staff use Excel as a calculator when it should be their data system. An employee who can write a VLOOKUP-driven consolidation, build a Pivot Table dashboard, and protect sheets with data validation so that others can't accidentally overwrite formulas saves 3-4 hours per week of manual rework. That skill is visibly valuable — managers see it in two weeks and it fast-tracks career progression.
Basic Calculations and Cell Referencing: The Foundation Every Excel User Must Know
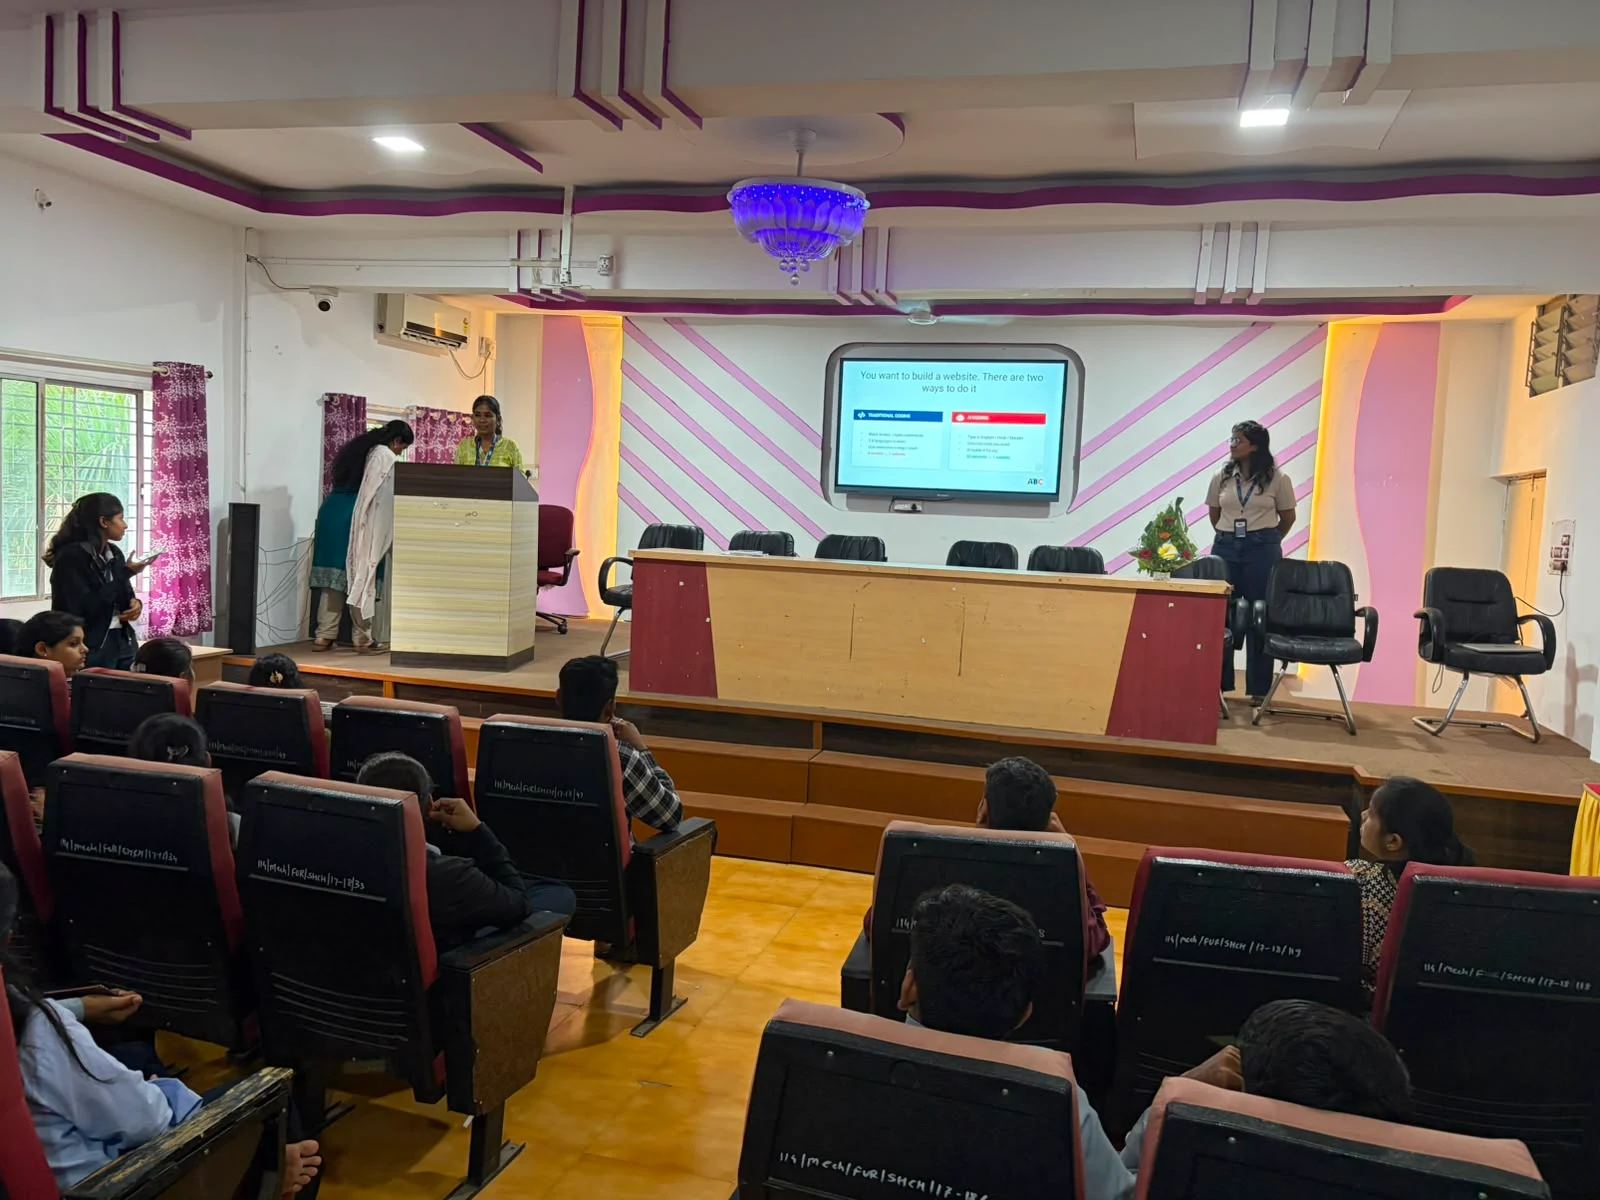
Before any formula works, Excel's cell referencing system must be internalized. Relative references (A1) move with the formula when copied — =A1+B1 copied to row 2 becomes =A2+B2. Absolute references ($A$1) stay fixed regardless of where you paste — essential for a tax rate or commission percentage that every formula in a column should point to. Mixed references ($A1 or A$1) fix one axis only — used in multiplication tables, grade matrices, and lookup-range construction. The ABC course starts here because every formula error in a real spreadsheet traces back to a reference type mistake: a VLOOKUP range that shifts when copied because the range wasn't absolute-locked, a profit calculation that divides by a blank cell because the denominator wasn't fixed. In the episode, the instructor demonstrates adding data to a structured Excel Table — and shows how the table automatically names the column (Subject Three) and extends formulas to new rows. This is the next level of referencing: structured table references like [@Subject1]+[@Subject2] that are human-readable and self-extending, replacing fragile cell addresses in production spreadsheets.
Core Statistical Functions: SUM, AVERAGE, COUNT, MIN, MAX in Real Work Contexts
SUM, AVERAGE, COUNT, COUNTA, MIN, and MAX are the statistical core that appears in every Excel spreadsheet ever built. But using them professionally requires more than typing =SUM(A1:A10). The real skill is scoped application: =SUMIF(C:C,"Pune",D:D) sums sales only for the Pune branch — the entry-level MIS formula. =COUNTIF(B:B,"Processing") counts jobs in a specific status — the operations dashboard formula. =AVERAGEIF(E:E,">0",F:F) averages only positive values (avoiding skew from zeroes and blanks) — the finance formula. In the ABC episode, the instructor builds these functions live on a two-column table with Subject 1 and Subject 2 marks, showing addition first as a formula, then as a SUM function, then extending with AVERAGE, COUNT, MIN, and MAX — each on a structured table so the results auto-update as new rows are added. The pattern taught: understand what you're counting or summing, what condition filters it, where the result lands — before typing anything.

Logical Functions: IF, Nested IF, AND, OR — Making Excel Think for You
The IF function is where Excel transitions from calculator to decision engine. Syntax: =IF(logical_test, value_if_true, value_if_false). Real examples from MIS work: =IF(C2>="60","Pass","Fail") grades students. =IF(D2>10000,"Senior","Junior") classifies leads. =IF(AND(B2="Pune",C2>5000),"Eligible","Not Eligible") filters on two conditions simultaneously. Nested IFs handle multiple tiers: =IF(A2>90,"A",IF(A2>75,"B",IF(A2>60,"C","D"))) assigns grades — but nested IFs become unreadable past three levels, which is why IFS() (multiple conditions in sequence) and SWITCH() (match a value to cases) were introduced in Excel 2019. The course covers all three approaches and teaches when to use each: IF for two outcomes, IFS for multiple tiers, AND/OR for compound logic. The business context the instructor uses: payroll calculations with conditional DA (dearness allowance) based on grade and location — exactly the kind of formula an HR executive needs in a 300-person manufacturing company.
Lookup Functions: VLOOKUP, HLOOKUP and When to Use Which
VLOOKUP searches for a value in the first column of a range and returns a value from a specified column in the same row. Syntax: =VLOOKUP(lookup_value, table_array, col_index_num, [range_lookup]). The fourth argument (range_lookup) is where most beginners go wrong: FALSE (exact match) is almost always what you want for data lookup; TRUE (approximate match) is for tiered lookups like tax brackets — and if you use TRUE on text data, VLOOKUP silently returns wrong results. HLOOKUP works identically but searches across the first row instead of the first column — useful for transposed datasets like time-series tables where months are columns and categories are rows. Common exam and interview question: "Why does your VLOOKUP sometimes return #N/A?" Answer: the lookup value in column A doesn't exist in the table range, the range isn't locked with $, or there's a hidden space in one of the values. The ABC course builds VLOOKUP exercises on realistic datasets — product codes with prices, student IDs with names and marks — so students hit and debug the real error cases rather than just copying the syntax.
INDEX and MATCH: The Lookup Combination That Professionals Actually Use
INDEX-MATCH is what Excel professionals use when VLOOKUP's one-direction constraint becomes a problem. VLOOKUP can only look left-to-right — the lookup column must be the leftmost column of the range. INDEX-MATCH has no such constraint. INDEX returns the value at the intersection of a given row and column in a range. MATCH returns the position of a lookup value in a range. Combined: =INDEX(B:B, MATCH(E2, A:A, 0)) finds E2 in column A, takes its row position, and returns the corresponding value from column B — but you can swap any column for B and it works, including columns to the LEFT of the lookup column. Practical case: employee database where Employee ID is in column C (middle), Name is in column A, and Department is in column E. VLOOKUP can't look left from column C to get the Name — INDEX-MATCH can. INDEX-MATCH is also faster on large datasets (100,000+ rows) because it searches once instead of scanning the entire table array. In Excel 365, XLOOKUP supersedes both — but INDEX-MATCH is the version-neutral professional standard that every interviewer still tests because it signals real Excel depth.
Text Functions: CONCAT, LEFT, RIGHT, MID, LEN for Data Cleaning and Reporting
Text functions clean and extract data — the underrated skill that saves hours in every data-heavy role. LEFT(text, n) extracts the leftmost n characters: =LEFT(A2,3) on "MH-12-AB-1234" returns "MH-". RIGHT(text, n) extracts from the right: =RIGHT(A2,4) returns "1234". MID(text, start, n) extracts from the middle: =MID(A2,4,2) returns "AB". LEN(text) returns character count — essential for checking if a mobile number has 10 digits (=LEN(B2)=10) or a PAN number has 10 characters. CONCAT (or CONCATENATE in older versions) joins strings: =CONCAT(A2," ",B2) merges first and last names. TRIM removes leading and trailing spaces that cause VLOOKUP #N/A failures. In MIS work, raw data from ERP systems arrives with inconsistent formatting — leading spaces, mixed case, concatenated codes that need splitting. Text functions are the pre-processing layer that makes every downstream formula reliable. The instructor in the ABC episode explicitly teaches that formulas and functions serve different purposes and introduces each text function with a practical case, not just the syntax — the approach that makes the skill stick.
Pivot Tables and Charts: Summarizing Thousands of Rows in Two Minutes
Pivot Tables are the single most powerful feature in Excel for analysts, MIS executives, and operations managers — and the most underused by people who learned Excel informally. A Pivot Table summarizes any dataset (sales data, production logs, attendance records) into an interactive cross-tabulation in seconds: drag Region to Rows, Product to Columns, Revenue to Values (Sum), and you have a branch-wise product revenue summary that took an hour to build manually yesterday. Refresh it after new data is added: one click. The ABC Trainings Excel course covers: creating a Pivot Table from a structured table or named range; adding row, column, filter, and value fields; grouping dates by month and quarter; adding calculated fields (=Revenue-Cost shows Profit per Pivot row without changing the source data); and formatting the Pivot Table for management reporting. Pivot Charts link directly to the Pivot Table — change a filter, the chart updates. Slicers provide one-click filtering for dashboards — connect one slicer to multiple Pivot Tables and charts so the entire dashboard filters by clicking a city or product name.
MIS Reports, Dashboards and Data Validation: Building What Managers Actually Use
MIS (Management Information System) reports are Excel workbooks designed so that operational staff can enter data and management can see live summaries — without anyone running a formula manually. Building a real MIS report involves: structured input tables with data validation (dropdown lists that prevent wrong entries, number limits that block negative inventory), named ranges so formulas read like =SUM(PuneRevenue) instead of =SUM(Sheet3!D2:D1000), SUMIF/COUNTIF formulas pulling from the input sheet into summary cells, conditional formatting that automatically highlights overdue items in red or top performers in green, and sheet protection so the dashboard area can't be accidentally edited while the input area remains writable. The ABC course builds one complete MIS report from scratch — data entry sheet, summary sheet, dashboard sheet with charts and KPI indicators — the kind of output you can show a hiring manager and say "I built this." That portfolio piece converts job applications into interview calls.
| Role | Experience | Salary (Rs. LPA) | Typical Sector |
|---|---|---|---|
| MIS Executive / Data Entry | 0-2 yrs | Rs.2.5-4 | Manufacturing, logistics, MSME |
| Data / Operations Analyst | 2-4 yrs | Rs.4-7 | NBFC, insurance, e-commerce |
| Senior MIS / FP&A Analyst | 5-8 yrs | Rs.8-15 | HDFC, Bajaj Finance, Mahindra |
| Data Scientist / Analytics Lead | 8+ yrs | Rs.15-30 | Tech, BFSI, consulting |
Excel/MIS salary data 2026 — Naukri/AmbitionBox/LinkedIn Salary estimates for Maharashtra
Excel Careers and Salaries in Maharashtra 2026: MIS, Accounts, Operations and Analytics
Excel-proficient professionals in Maharashtra earn across a wide band depending on seniority and industry. Entry-level MIS executives (1-2 years) at manufacturing companies and logistics firms: Rs.2.5-4 LPA. Data analysts and finance executives using advanced Excel plus basic Power BI at Pune NBFCs, insurance companies, and e-commerce companies: Rs.4-7 LPA. Senior MIS managers, FP&A analysts, operations analysts at large companies (HDFC, Bajaj Finance, Mahindra Finance) with 5+ years of Excel depth: Rs.8-15 LPA. The progression is clear: Excel alone gets you the first job; Excel plus Power BI plus SQL gets you the analyst roles; Excel plus Python/R plus Power BI makes you a data professional earning Rs.12-20 LPA within 5-7 years. ABC Trainings teaches Advanced Excel as the foundation layer for the IT and data analytics track — the same centers (Wagholi, CIDCO, Osmanpura) run Python, Data Science, and Full Stack courses so the learning path is continuous. CMYKPY eligibility: Advanced Excel and computer training at ABC Trainings qualifies — eligible Maharashtra youth (18-35) get Rs.6,000-10,000/month during training. Call 7039169629 for batch dates.
The Mukhyamantri Yuva Karya Prashikshan Yojana 2026 covers computer and IT skills training, including Microsoft Excel. Eligible Maharashtra youth (18-35) get Rs.6,000/month (12th pass), Rs.8,000/month (ITI/Diploma) or Rs.10,000/month (graduate) stipend during approved training at ABC Trainings. Walk in to any center and we complete your CMYKPY registration same day — call 7039169629 for batch dates and eligibility check.
Get the Computer Courses Brochure + Fees + Batch Dates on WhatsApp
Free 1:1 counselling. Placement track record. CMYKPY/PMKVY eligibility check.
💬 Get Brochure on WhatsApp📞 Call 7039169629About the author: Amit Kulkarni. 6 yrs MS Office and data analytics training; corporate Excel trainer for BFSI and manufacturing MIS teams.
Visit Our Centers
- Wagholi (Pune): 1st Floor, Laxmi Datta Arcade, Pune-Ahilyanagar Highway. Call 7039169629
- Hadapsar (Pune HQ): 1st Floor, Shree Tower, opp. Vaibhav Theater, Magarpatta. Call 7039169629
- Cidco (Chh. Sambhajinagar): Kalpana Plaza, opp. Eiffel Tower, N-1 Cidco. Call 7039169629
- Osmanpura (Chh. Sambhajinagar): S.S.C Board to Peer Bazar Road, near Jama Masjid. Call 7039169629
- Sangli: Shubham Emphoria, 1st Floor, Above US Polo Assn., Sangli-Miraj Rd, Vishrambag. Weekend batches available. Call 7039169629
FAQs
What is the difference between VLOOKUP and INDEX-MATCH in Excel?
VLOOKUP searches only from left to right — the lookup column must be the first (leftmost) column of your table range. INDEX-MATCH has no directional restriction: it can look up in any column and return values from any other column, including columns to the left. INDEX-MATCH is also faster on large datasets. For most jobs, learn VLOOKUP first (it's simpler and appears in every interview), then learn INDEX-MATCH to handle the cases VLOOKUP can't. Excel 365 introduced XLOOKUP which replaces both — but INDEX-MATCH is the version-neutral standard most employers test.
How long does it take to learn Advanced Excel at ABC Trainings?
The ABC Trainings Advanced Excel curriculum takes 1.5 to 2 months of regular classes (45-60 hours of instruction and practice). The course covers basic formulas, IF logic, VLOOKUP, INDEX-MATCH, text functions, Pivot Tables, conditional formatting, data validation, and MIS report building. Morning and evening batches are available at Wagholi, Hadapsar, CIDCO (Sambhajinagar), Osmanpura, and Sangli centers. Call 7039169629 for the next batch start date.
What salary can I expect after completing Advanced Excel training in Pune?
Entry-level MIS executive and data entry roles in Pune pay Rs.2.5-4 LPA for candidates with solid Advanced Excel skills. Operations and data analyst roles at finance companies, NBFCs, and e-commerce firms pay Rs.4-7 LPA with 2-4 years of experience. Adding Power BI and SQL to Advanced Excel pushes salaries to Rs.8-15 LPA at senior analyst level within 5-8 years. Excel proficiency is the minimum bar; what differentiates candidates is Pivot Table dashboards, INDEX-MATCH, and the ability to build protected MIS reports that others can use.
Is Advanced Excel training at ABC Trainings eligible for CMYKPY government stipend?
Yes. Computer skills and IT training including Microsoft Excel courses at ABC Trainings are eligible for the CMYKPY (Mukhyamantri Yuva Karya Prashikshan Yojana) government stipend — Rs.6,000-10,000 per month depending on education level (12th pass: Rs.6K, ITI/Diploma: Rs.8K, Graduate: Rs.10K). Enroll at cmykpy.mahaswayam.gov.in or let ABC's counsellors process your application during your first center visit.