
Microsoft Power BI Complete Course Guide 2026: From Zero to Dashboard Pro (Updated August 2026)
NASSCOM and Deloitte project a demand for 1.25 million AI and analytics professionals in India by 2027 — and Microsoft Power BI has emerged as the gateway skill that turns that demand into hiring. Power BI is free to download, connects to virtually any data source, and produces interactive dashboards that non-technical managers can use without training. ABC Trainings' Proficient Course in Power BI covers the full journey from installation and first report through data visualization, advanced filters, KPI cards, geographic maps, DAX formulas and multi-table data modeling — all taught by an ABC trainer with live, follow-along exercises in every episode.

- Power BI Desktop is free to download and is the fastest way to start building data dashboards for Indian business environments
- This guide covers every episode of ABC's Power BI series: installation → data connections → charts → filters → maps → KPIs → DAX → data modeling
- Power BI analysts and business intelligence professionals in Pune earn ₹4–10 LPA; senior Power BI developers at TCS, Infosys and Wipro reach ₹12–18 LPA
- Power BI skills are tested at entry-level in finance, manufacturing, pharma and IT companies across Maharashtra
- ABC Trainings offers Power BI training at Wagholi, Hadapsar, Cidco, Osmanpura and Sangli — weekday and weekend batches
What Is Power BI and Why Is Every Industry in India Adopting It?
Microsoft Power BI is a business intelligence and data visualization platform that lets you connect to raw data — from Excel spreadsheets, SQL databases, cloud services or ERP systems — and turn it into interactive dashboards that update automatically. Here's why every industry in India is adopting it: Power BI Desktop is completely free; Power BI Service (the cloud version) costs ₹810 per user/month on the Pro plan; and the skill has a measurably low learning curve compared to alternatives like Tableau or SSRS. In manufacturing, finance, pharma and IT companies across Pune, Mumbai and Hyderabad, Power BI has become the standard tool for monthly performance dashboards, sales tracking, production efficiency reports and supply chain visualization. Infosys, TCS, Wipro, L&T and Bajaj Auto all have Power BI in their analytics toolkit. For a fresher or a working professional looking to break into data roles, Power BI is the single highest-ROI analytics skill you can add in 90 days.
Getting Started with Power BI: Installation and Your First Data Report
ABC Trainings' Power BI Episode 1 starts exactly where a beginner needs to start: understanding what Power BI is, why it was developed by Microsoft, what the three components are (Power BI Desktop, Power BI Service, and Power BI Mobile), and how to download and install Power BI Desktop on your Windows machine. Episode 2 dives into the interface basics — the Report view, Data view, and Model view; connecting to an Excel file as your first data source; and importing data into the Power BI canvas. The trainer covers the Get Data button in detail, explaining how to connect to Excel, CSV, SQL Server, web URLs and SharePoint — each of which is used in real corporate environments. By the end of Episode 2, you have a working Power BI file with data loaded and are ready to start building your first visual.
▶ Watch this step free on ABC's YouTube: Power BI Introduction — What It Is and Why to Learn It (Episode 1)
▶ Watch this step free on ABC's YouTube: Power BI Basics: Interface, Data Connection and First Import (Episode 2)
Data Visualization in Power BI: Charts, KPI Cards and Geographic Maps
Episode 3 of ABC's Power BI series covers data visualization in depth — the part most people associate with Power BI: making charts. The trainer walks through every major visual type: bar chart, stacked bar, clustered column, line chart, area chart, pie chart, donut chart, and the matrix (which is Power BI's version of a pivot table). Episode 5 then covers all the specialized chart types: funnel chart, scatter plot, waterfall chart, ribbon chart and the tree map — each with a live dataset so you understand when to use which chart type. Episode 6 covers geographic maps in Power BI: bing maps for plotting by city/country, filled maps for region coloring, and the ArcGIS visual for advanced geographic analysis. Episode 7 covers KPI cards — the single-number tiles that show performance against a target, which appear on virtually every executive dashboard in Indian corporate environments.
▶ Watch this step free on ABC's YouTube: Data Visualization in Power BI: All Chart Types Explained (Episode 3)
▶ Watch this step free on ABC's YouTube: KPI Cards and Performance Metrics in Power BI (Episode 7)

Power BI Filters, DAX Formulas and Data Modeling: Intermediate to Advanced
Episode 4 covers Power BI Filters — one of the most important intermediate skills that separates a Power BI beginner from someone who can build production-ready reports. The trainer explains the three filter types: visual-level filters (apply to one visual only), page-level filters (apply across a whole report page) and report-level filters (apply to the entire report). Slicers — the interactive filter tiles that let dashboard users drill down by date, category or region — are covered in depth, including the difference between list slicers, dropdown slicers and between-date slicers. Episode 8 introduces DAX (Data Analysis Expressions) — Power BI's formula language. The trainer starts with the most essential DAX measures: SUM, AVERAGE, COUNT, COUNTROWS, CALCULATE (the most powerful and most misunderstood DAX function), and RELATED (for cross-table lookups). DAX is where Power BI separates from Excel — it allows calculated measures that update dynamically based on filter context, which is essential for any real corporate dashboard. Data modeling — relating tables via one-to-many and many-to-many relationships in the Model view — is covered alongside DAX since these two concepts are inseparable.
Power BI Jobs and Salary in Pune, Hyderabad and Pan-India (2026)
Power BI professionals in India are in genuine demand in 2026. Based on Glassdoor and AmbitionBox data: entry-level Power BI Analysts in Pune with 0–2 years earn ₹4–6 LPA at companies like Infosys, Wipro, L&T Infotech and Bajaj Finserv. Mid-level Business Intelligence Developers with 2–5 years earn ₹6–10 LPA. Senior Power BI Developers and BI Architects with 5+ years and Azure or SQL Server expertise earn ₹12–20 LPA at TCS, Accenture, Capgemini and KPMG. Power BI skills are no longer limited to IT companies — manufacturing and FMCG companies (Whirlpool India, Bajaj Auto, L&T) and pharma companies (Lupin, Sun Pharma) all have internal Power BI analyst roles. For fresh graduates from Pune's engineering and MBA colleges, adding Power BI certification (PL-300 exam) to a resume produces a measurable improvement in interview callback rates for data analyst and business analyst roles.
Power BI vs Tableau vs Excel: Which Analytics Tool to Learn in 2026?
The honest comparison: Excel is not a replacement for Power BI once your data exceeds 100,000 rows or requires automatic refresh — but you need Excel competency before you can use Power BI effectively, since the two tools share concepts (pivot tables translate directly to matrices). Tableau is Power BI's closest competitor and is arguably more powerful for advanced data visualization and custom chart design — but Tableau Desktop licenses cost ₹5,000–₹8,000/month vs Power BI Desktop being free. In the Indian job market, Power BI wins on volume: there are more Power BI jobs posted on LinkedIn and Naukri than Tableau jobs, particularly in non-FAANG companies in Pune, Hyderabad and Mumbai. Learn Power BI first; add Tableau if your target company uses it specifically. Google Data Studio / Looker is relevant for marketing analytics roles — but for manufacturing, finance and corporate BI, Power BI is the dominant tool in India.
| Tool | Best For | Cost (Desktop) | India Jobs (Naukri, 2026) |
|---|---|---|---|
| Power BI | Corporate BI, manufacturing, finance | Free (Desktop) | High volume — 15,000+ active listings |
| Tableau | Advanced viz, FAANG, MNCs | ₹5,000–8,000/mo | Moderate — 5,000+ listings |
| Excel (Pivot + Power Query) | Small datasets, finance reports | Part of MS Office | Very high — implicit in most JDs |
| Looker / Google Data Studio | Marketing, e-commerce analytics | Free | Low — niche market in India |
Power BI Training at ABC Trainings: Course Structure and Enrollment
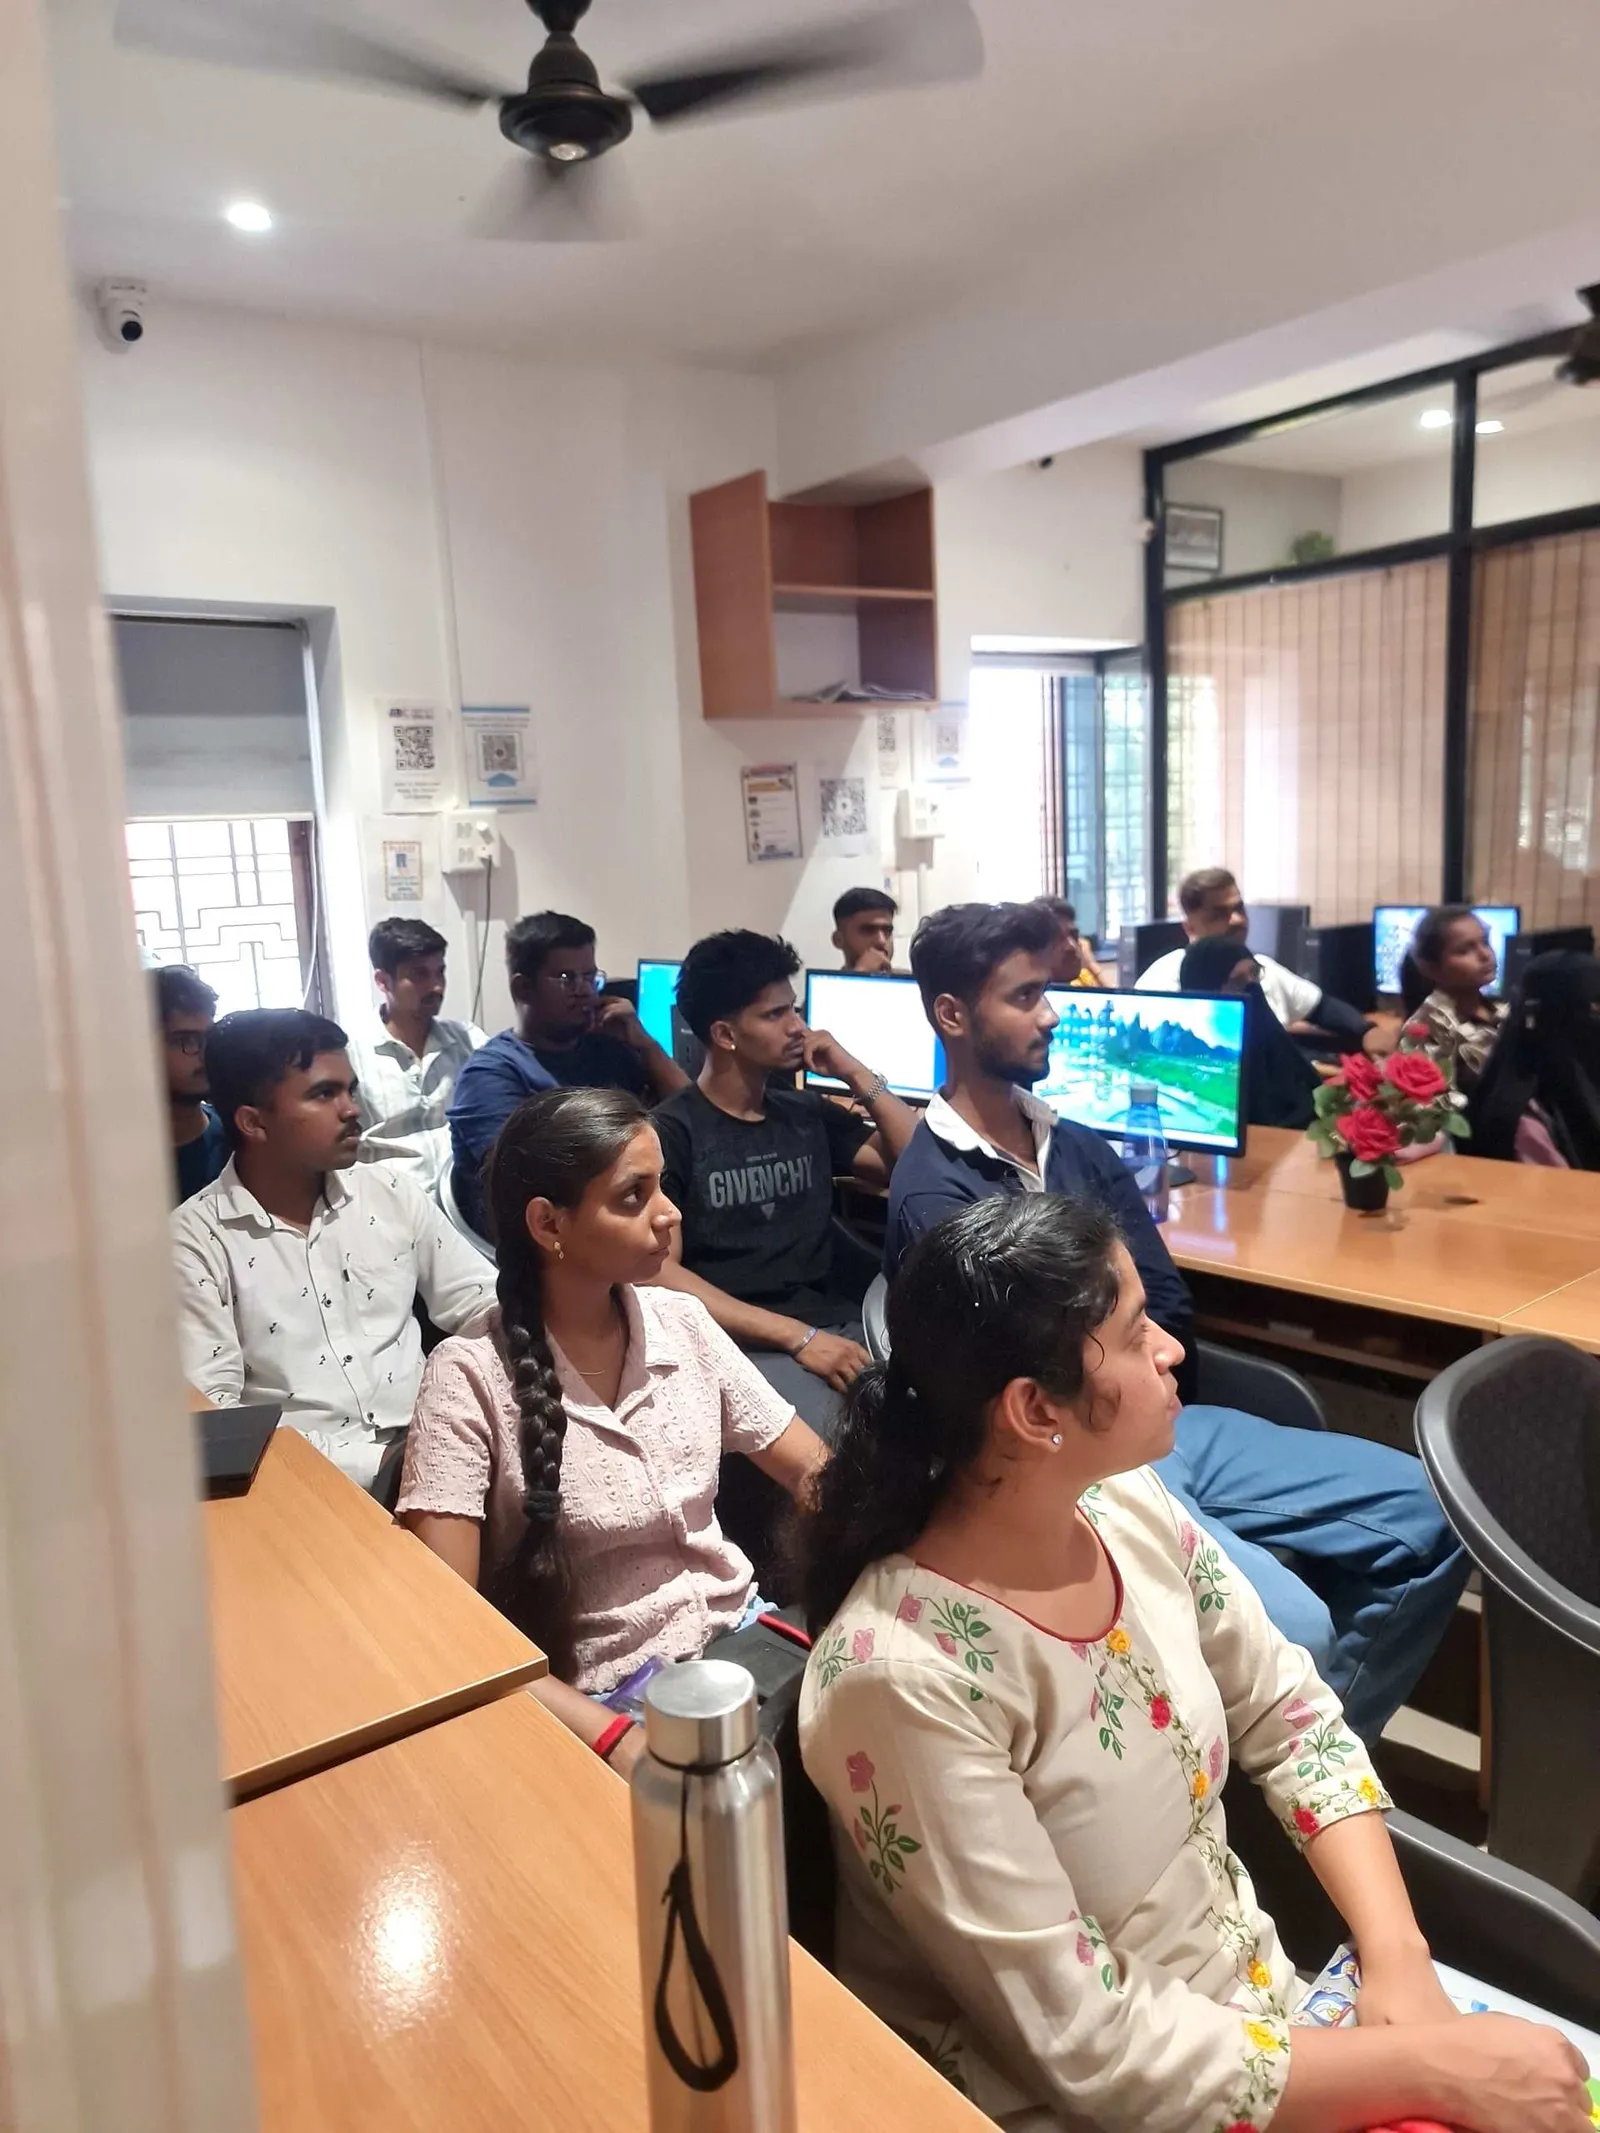
ABC Trainings offers the Proficient Course in Power BI at centers in Wagholi (Pune), Hadapsar (Pune HQ), Cidco (Sambhajinagar), Osmanpura (Sambhajinagar) and Sangli. The course runs for 2–3 months and covers the full Power BI stack: data connections and import; data transformation using Power Query (M language basics); all visualization types; advanced filtering and slicer design; DAX measures and calculated columns; data modeling with table relationships; Power BI Service (publishing and sharing); and a capstone dashboard project using real-world data that becomes your portfolio piece. Maharashtra CMYKPY and PMKVY 4.0 subsidies of ₹6,000–₹10,000 are available for eligible students — walk in to check eligibility. Weekend batches are available at Pune centers for IT professionals and working executives who want to add analytics skills without disrupting their current job. Call 7039169629 or WhatsApp 7774002496.
Maharashtra CMYKPY and PMKVY 4.0 subsidies of ₹6,000–₹10,000 are available for eligible students enrolling in Power BI and data analytics training. Call 7039169629 to check eligibility at your nearest ABC Trainings center.Get the AI Powered Application Development Brochure + Fees + Batch Dates on WhatsApp
Free 1:1 counselling. Placement track record. CMYKPY/PMKVY eligibility check.
💬 Get Brochure on WhatsApp📞 Call 7039169629About the author: Rahul Patil. 12 yrs experience training engineers across Maharashtra.
Visit Our Centers
- Wagholi (Pune): 1st Floor, Laxmi Datta Arcade, Pune-Ahilyanagar Highway. Call 7039169629
- Hadapsar (Pune HQ): 1st Floor, Shree Tower, opp. Vaibhav Theater, Magarpatta. Call 7039169629
- Cidco (Chh. Sambhajinagar): Kalpana Plaza, opp. Eiffel Tower, N-1 Cidco. Call 7039169629
- Osmanpura (Chh. Sambhajinagar): S.S.C Board to Peer Bazar Road, near Jama Masjid. Call 7039169629
- Sangli: Shubham Emphoria, 1st Floor, Above US Polo Assn., Sangli-Miraj Rd, Vishrambag. Weekend batches available. Call 7039169629
FAQs
Is Power BI free to learn and use in India?
Yes — Power BI Desktop is completely free to download and use from Microsoft's official website. You can build dashboards, connect to Excel files, SQL databases and web sources, and create professional-grade reports at no cost. Power BI Service (the cloud portal for sharing and publishing) requires a Pro license at ₹810/user/month for corporate sharing — but for learning and personal portfolio projects, the free desktop version is sufficient for everything you need.
What is the salary of a Power BI analyst in Pune in 2026?
Power BI analysts in Pune earn ₹4–6 LPA at entry level (0–2 years), ₹6–10 LPA at mid-level (2–5 years) and ₹12–20 LPA at senior BI Developer or BI Architect level. Companies actively hiring Power BI professionals in Pune include Infosys, Wipro, L&T Infotech, Bajaj Finserv, Capgemini, KPMG India and multiple BFSI and manufacturing analytics teams. Adding Azure Data Factory or SQL Server skills alongside Power BI significantly accelerates salary growth past the ₹10 LPA mark.
How long does it take to learn Power BI for a fresher?
A motivated beginner with no prior experience can become functional in Power BI — able to build a working dashboard from Excel data — in 2–3 weeks of regular practice. A complete course covering data visualization, advanced filters, DAX measures and data modeling takes 2–3 months at ABC Trainings. Most students are portfolio-ready (able to show a sample dashboard to an interviewer) by the end of the course.
Which certification is best for Power BI professionals in India?
The Microsoft Power BI Data Analyst Certification (PL-300) is the industry-recognized certification for Power BI professionals in India. It validates skills across data preparation, data modeling, data visualization and deployment. The exam costs approximately ₹4,000–5,000 and is offered through Pearson VUE test centers in Pune, Mumbai and Hyderabad. ABC Trainings prepares students for this exam as part of the advanced module of its Power BI course.